I pulled the Unit Data from Atlaspedia to a .csv
 Outbreak
Member
Outbreak
Member
(I don't know if this is the correct forum and I can't attach the files directly so I'll paste them in plain-text. If this isn't allowed by the devs, please feel free to move, edit, or remove the post.)
Here is a .csv file containing all of the unit information from the Atlaspedia tables. I'm pretty horrible with graphs and charts so I figured someone more talented than me could find a good way to present the information.
I'll also include the javascript functions I used to pull the info out of the tables. The javascript adds a button to the top-left of the Atlaspedia page that lets you download whichever table you're currently looking at as a .csv. All you have to do is paste the contents of the javascript file into a Chrome dev console and press enter to add the button.
Hope this is helpful!
CSV
Hero,Unit Name,Teir,Cost,Health,Damage,Attack Cooldown,Damage per Second,Range,Speed,Unit Cap
Alder,Alder,0,0,415,23,1.5,15.3,7,4.3,0
Alder,Seedbot,1,150,350,15,1.5,10,5.5,4.1,8
Alder,Grove Tender,2,225,125,22,2.2,10,10,3.6,3
Alder,Bramblethorn Goliath,3,275,875,120,2.3,52.2,3,3.7,2
Celesta,Celesta,0,0,360,17,1,17,7,4.7,0
Celesta,Wisp,1,50,90,7,0.6,11.7,5.5,4.9,18
Celesta,Purifier,2,225,200,35,2.5,14,12,3.5,4
Celesta,Precognitor,3,250,120,30,1.6,18.8,10,3.9,2
Eris,Eris,0,0,330,32,1.8,17.8,7,4.7,0
Eris,Sandstinger,1,50,100,16,2.1,7.6,6,4.7,18
Eris,Devilkin Dervish,2,225,155,60,3.5,17.1,9,4.1,4
Eris,Apocalyte,3,275,100,30,2,15,10,4,2
Grath,Grath,0,0,440,22,1.5,14.7,5.5,4.4,0
Grath,Terrapin Trooper,1,100,315,15,1.5,10,1,4.1,9
Grath,Howling Commando,2,225,450,40,2.1,19,3.5,4,4
Grath,Rustborn Rhino,3,275,1100,60,2.9,20.7,1.5,4.1,2
Hydros,Hydros,0,0,480,18,1.2,15,4,4.2,0
Hydros,Scuttleguard,1,100,345,14,1.6,8.8,1,4.1,9
Hydros,Quadrapus,2,225,125,20,2.3,8.7,8,4,4
Hydros,Aquadillo,3,275,840,80,3.5,22.9,2,4.3,2
Ryme,Ryme,0,0,425,24,1.6,15,6,4.3,0
Ryme,Glacial Ranger,1,100,285,17,1.3,13.1,6.5,4.4,9
Ryme,Frostcaller,2,225,125,35,1.6,21.9,10,4,3
Ryme,Ancient Ice Frog,3,275,875,60,1.7,35.3,4.5,4,2
Vela,Vela,0,0,320,28,1.6,17.5,9,4.9,0
Vela,Raptor,1,75,125,19,1.6,11.9,8,5.2,12
Vela,Deadeye,2,225,175,51,3.4,15,12,4.4,4
Vela,Windray,3,275,150,30,2.3,13,10,4.4,2
Vex,Vex,0,0,340,20,1.1,18.2,8,4.3,0
Vex,Sparkbot,1,75,155,8,1,8,7.5,4.3,12
Vex,Ignitor,2,200,125,10,1.4,7.1,12,4.3,4
Vex,Pyrosaur,3,300,840,45,2.5,18,7,4.4,2
Javascript
var getTableData = function(originalTable) {
    var tableData = [];
    var tableCols = originalTable.rows[0].children.length
    var tableRows = originalTable.rows.length
    for (var i = 0; i < tableCols; i++) {
        var tempRow = []
        for (var j = 0; j < tableRows; j++) {
            tempRow.push(originalTable.rows[j].children[i].innerText);
        }
        tableData.push(tempRow)
    }
    return tableData;
}

var getUnitNames = function(units) {
    var unitNames = [];
    for (var i = 0; i < units.length; i++) {
        unitNames.push(units[i].innerText);
    }
    return unitNames;
}

var insertUnitNames = function(tableData, unitNames) {
    var updatedTable = tableData.slice()
    updatedTable[0].splice(0, 0, "Unit Name")
    for (var i = 0; i < unitNames.length; i++) {
        updatedTable[i+1].splice(0, 0, unitNames[i])
    }
    return updatedTable
}

var convertToCSV = function(tableData) {
    var csv = ""
    for (var row = 0; row < tableData.length; row++) {
        for (var col = 0; col < tableData[0].length; col++) {
            csv += tableData[row][col] + ","
        }
        csv += "\n"
    }
    return csv
}

var main = function() {
    var originalTable = document.getElementsByTagName("table")[0];
    var tableData = getTableData(originalTable);

    var units = document.getElementsByClassName("unit-name");
    var unitNames = getUnitNames(units);

    var updatedTableData = insertUnitNames(tableData, unitNames);
    var csv = convertToCSV(updatedTableData);

    var dlLink = document.createElement("a");
    dlLink.download = "data.csv";
    dlLink.href = "data:application/csv," + escape(csv);
    dlLink.click()
}

var createDownloadButton = function(func) {
    var button = document.createElement("input");
    button.type = "button";
    button.value = "Download";
    button.onclick = func;
    document.getElementsByClassName("page")[0].insertBefore(button, document.getElementsByClassName("atlaspedia")[0]);
}

createDownloadButton(main);
Comments
If anyone is able to make use of this data, please post it! It would be great to see visual comparisons between the squads.
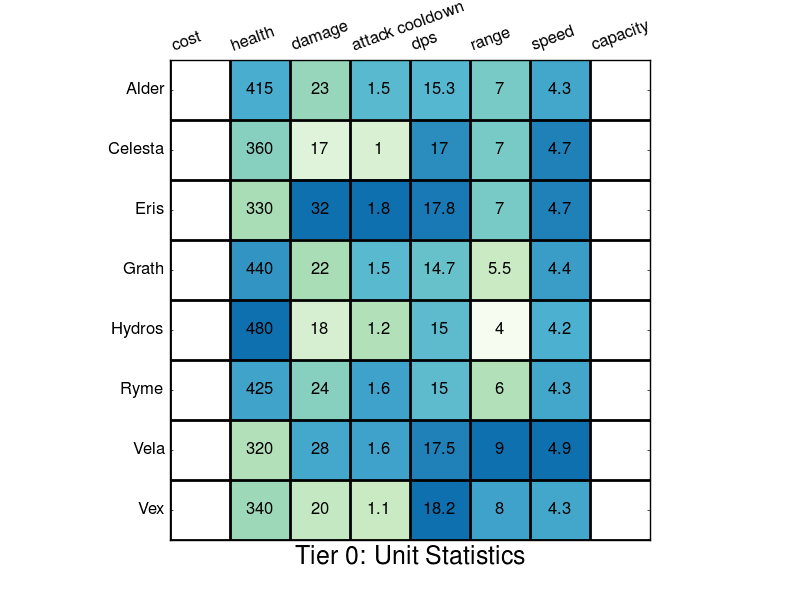
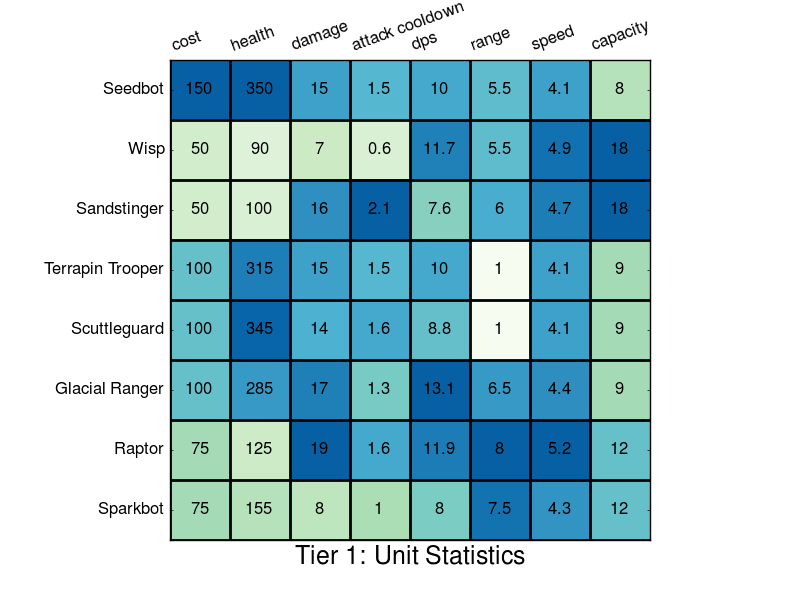
I don't know how useful they'll be, but I've made a couple bar graphs. I'd be happy to make any other charts on request.
Note that all stats of a given type are normalized on the same scale, so you can compare e.g. a plot of tier 1 units with one of tier 2 units. So you can see, for example, that Raptors are the fastest unit in the game. Due to the normalization, I have not included a y-axis scale.
Yooooo these graphs are so cool! And really show how overpowered Ryme's whole kit is :D
@Aethallyn that's awesome!
OK, now if someone can get the #'s for abilities (for example, how much a pulse of a Quad's ability heals), we can really do some science!
Eris' T1 units have such low dps we should buff them >_>
In all seriousness, it would be valuable to try and determine burst damage capabilities per squad/unit as well, though that is likely beyond the scope of this data on its own.
I've been doing some analysis of cost efficiency of unit stats with the data so far (but my graphs aren't pretty enough yet ) but I'll try to see if I can add in some graphs of burst potential (mainly from Eris or Ryme) with different unit comps, and compare that to some unit health values (e.g. I know just from my personal play that 5 Glacial Rangers deal just about enough burst damage to instakill one Sandstinger)
Here's the number of hits it takes tier 1 units to kill each other (assuming no armor).
You can read the graph as giving the number of hits it takes the unit on the left to kill the unit on the top. For example, it takes a Wisp 50 hits to kill a Seedbot, but it only takes a Seedbot 6 hits to kill a Wisp.
I have also rounded these numbers up, so a fractional hit counts as a full hit.
Wisp OP Confirmed
But really, once you factor in cost and microability (Wisps cost 1/3 of a Seedbot so you have 3 Wisps per Seedbot, plus wisps move faster and have a smaller collision size which makes them easier to micro) I think early game felt pretty balanced overall. It's a little depressing to see in numbers how fast everything kills my precious Wisps though!
For fun, here's the same chart, but with everything!
Edit: Made it clickable.
@Pursuit, Wisps also have the fastest attack in the game, which is not reflected here. I might make the same chart with time to kill instead of hits.
Edit: Here we go, times to kill. Note that this uses hits to kill multiplied by attack cooldown to try to give a more accurate time than just using DPS.
Hoooooly shit these charts are SICK! This is so useful for comparing early game army strengths!!! WOW!
HOOOOOLY SHIT LOOOL THESE ARE AMAZING!!!
THIS IS SO BEAUTIFUL! :D :D
Maybe a T1 chart where each number is divided by the cost of the units? Then we can see the time to kill per dollar :D.
I have dps/coin and health/coin for all units in a google doc! but my graphs aren't as pretty, and I don't know how to make google docs label them correctly... Maybe I should just share the link to the google doc here instead so you guys can see what I've made.
@Artillery.Day[9];, something like this?
If you could provide armor values for units, I could make it more accurate. Also, if I were a daily tester, I could more easily make more of these charts as stats change ::wink, wink, nudge, nudge, say no more::
Wisps are looking pretty good now, @Pursuit.
huh, well look at which unit needs a buff... :D:D:D
Or just to account for saplings in charts like these...
Wow @Aethallyn thank you so much for doing these! I knew the potential of this data but I don't have the skills you do.
Thanks for providing something so great to the community =)
@AlienTree If you have anything in your google docs that I haven't done, I'd love to see it, even if it's not pretty. I'd offer to help make it pretty, but I really know very little about using spreadsheet software --- I made all my things in python.
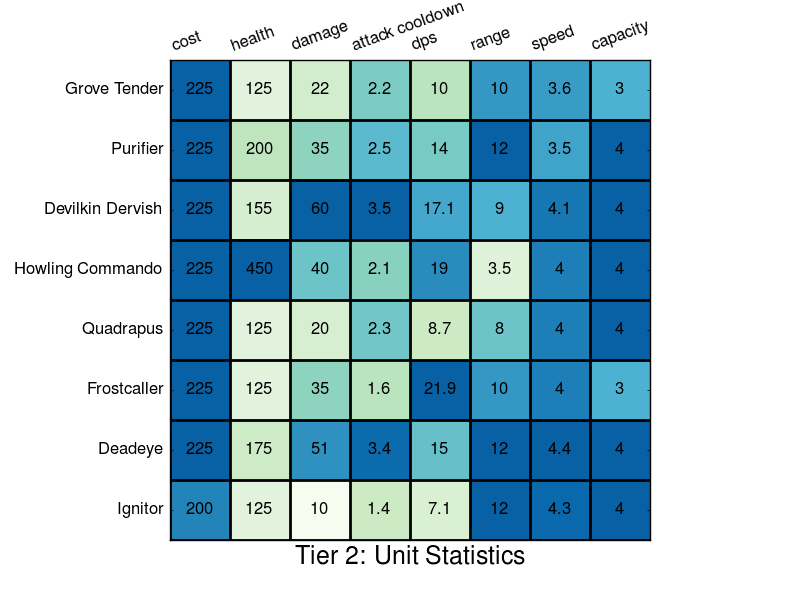
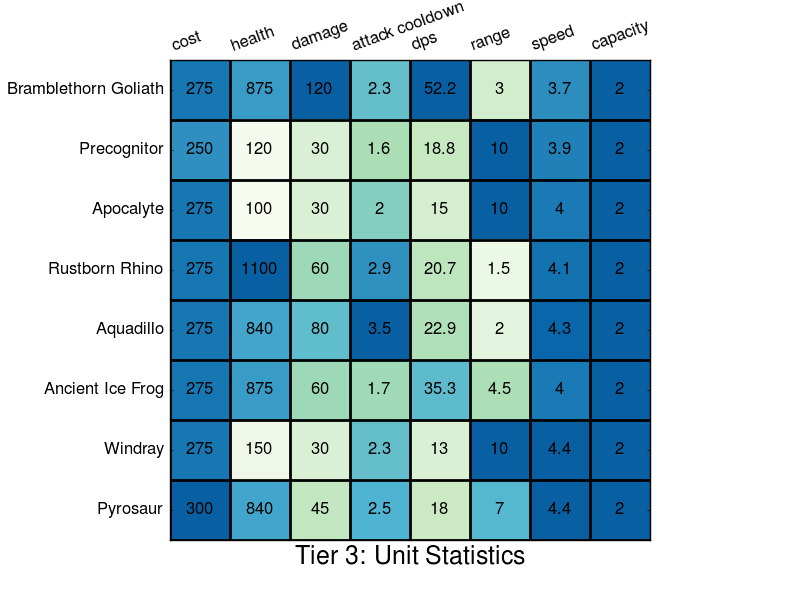
Edit: Inspired by @AlienTree's google doc, here's some more charts.
Unit statistics in a nice, easy to see form:
And here are just the extrinsic statistics, normalized for cost for non-hero units:
I made an upgrade flowchart! It almost certainly has some errors, though, so feel free to point them out and I can fix it up.
Edit: Incorporated Jeekaroose's fixes. Thanks, @Jeekaroose.
Dude that upgrade flowchart is sick, that's exactly what I was trying to find last night. Nice! Also really cool visualizations of the gold efficiency comparisons I was doing :D
Attack speed +12% doesn't actually lead to attack speed +12%, right?
@Jeekaroose that's what I remember seeing. Go into a game and see! Then let me know.
i'm seeing http://screencast.com/t/g8TqcNBUowqk
which makes significantly more sense to me since it's not literally giving you nothing for 400g
edit: more errata: 15% AD/10% LS leads to 30% AD/20% LS and 30% AD/10% LS/10% HP
Oh wow, thank you so much for doing that upgrade chart.
I didn't even know T3 armor upgrades had cool extra bonuses like that!
Even without the awesomeness of a flow chart, this data isn't currently written down anywhere else right now so it's mega-useful.
OK, this whole process got my brain juices flowing, so I went and captured a few data points of how much damage reduction you get from points of resistance. Note that while my image says "physical resist", it looks like both physical and magical follow the same rate of return.
I was going to extrapolate a curve here (though Excel's curve-matching wasn't terribly good) and, in turn, potentially see how much longevity each unit gets from upgrading. However, I don't think there's going to be anything mind-blowing here. Because this isn't a flat-point damage reduction like in SC2, but instead a percentage, it won't affect fast-firing units more than slow-firing ones. It's unlikely that there will be any huge beneficial bonuses like protoss +1 attack making zealots kill zerglings in 2 swings vs 3.
Looking at a few baseline values (100 armor = 50% reduction, 200 armor = 67% reduction), it looks to me like resists in Atlas work exactly the same as Armor and Magic Resist do in League of Legends.
That means there are no diminishing returns as far as effective HP. In League, 1 armor/MR gives you 1% more EHP.
It looks like it's the same formula league of legends uses; damage is multiplied by 100/(100 + armor).
It means that 1 armor always gives you 1% more effective health.
BTW, where did you get those numbers, @SpideyCU ? Is there a tooltip in game or something that I've missed?
@Aethallyn , if you hold Shift + Tab in-game it gives you stats on your units. I took notes from doing various combinations of upgrades.